Pharmacokinetics of new analgesic tridecapeptide with an octaarginine vector investigated after original analytical approach
The work was done under financial support by the Government of the Russian Federation faced with the Ministry of education and science of the Russian Federation (State contract 14. N08.12.1039, code 2015-14-N08-0028).
Kosman V.M. , Faustova N.M., Karlina M.V., Makarov V.G., Makarova M.N. Pharmacokinetics of new analgesic tridecapeptide with an octaarginine vector investigated after original analytical approach. Laboratory Animals for Science. 2022; 4. https://doi.org/10.57034/2618723X-2022-04-08
Abstract
A new analgesic tridecapeptide (TDP) with an octaarginine vector has been proposed for clinical use in chronic pain syndrome. The work investigated the pharmacokinetic properties of TDP in the form for oral administration. The special analytical approach was proposed because classical chromatography methods are low-powerful for peptide quantification in biological matrices.
The study was conducted on male rats and rabbits with a single oral administration of the drug in three doses, a single intravenous administration in one dose and multiple administrations to rats in one dose. To determine the TDP concentration in blood plasma, tissues, and excretes, an enzyme immunoassay with a commercially available reagent kit for a similar target analyte (Elisa kit for 1-Deamino 8D-Arginine Vasopressin) was developed and partially validated. Pharmacokinetic parameters were calculated using the non-compartment method of statistical moments.
The pharmacokinetics of TDP was found to be linear after a single administration in the dose range of 10–50 mg/kg for rats and 5–25 mg/kg for rabbits. The absolute bioavailability of the TDP after oral via intravenous administration in rats and rabbits were about 8–16%.
The active substance was intensively distributed to muscles, liver and spleen; the lowest tissue distribution was detected in the kidneys. TDP was excreted with urine in trace amounts (about 0.2%), with feces — about 1.2%; repeated administration did not lead to its accumulation.
The pharmacokinetics parameters of the new analgesic tridecapeptide were evaluated after the original analytical approach. The final study included all main areas necessary to characterize the original drug pharmacokinetics.
Introduction
Opioid peptides, firstly, morphine, are widely used as effective analgesics, but have serious disadvantages because they affect the central nervous system of a person, and with their repeated use, syndromes of mental and physical dependence occur [1].
Peptide synthesis is one of the perspective dimensions for effective and safe analgesic research. The antinociceptive effect of the synthetic peptide Tyr-D-Arg-Phe-Gly-NH2 exceeded that of morphine activity by 6 times [2]. However, the systemic administration of tetrapeptide for 5 days was accompanied by the development of tolerance to the analgesic effect of this peptide in mice [3]. Recently, a new tridecapeptide compound (TDP, H-Tyr-D-Arg-Phe-Gly-(D-Arg)8‑Gly-OH•10HCl) was studied for its analgesic therapeutic potency [4]. This peptide was synthesized on the basis of another tetrapeptide (Tyr-D-Arg-The-Gly) by the inclusion of the (D-Arg)8 vector.
TDP appears effective in a few pharmacological models in various animals — acetic acid-induced writing tests in mice and chronic constriction injury procedure in rats. After reporting results, it was effective as an analgesic agent comparable to morphine efficacy and has lack tolerance development after repeated administration; the absence of cross-tolerance to morphine and the ability to prevent morphine tolerance development were also shown [4]. After these advantages, TDP was recommended for clinical use in chronic pain syndrome (CPS).
Analgesics used for long-term therapy of CPS are better to have non-invasive modes of administration — “whenever possible should be given by mouth” [5]. Due to the instability of peptides in the gastrointestinal content medium, their absorption by oral administration remains unsatisfactory and more suitable delivery systems are required for non-parenteral and in particular oral administration of peptides [6–8]. For TDP, this problem was solved by developing the drug form of enteric coated tablets for oral administration [9].
The pharmacokinetics studies are one of the necessary parts of the drugs’ preclinical investigations. The study of the pharmacokinetics of the original drug should include assessment of the kinetics of absorption, distribution and elimination of pharmacological agents in the organism [10, 11].
This study investigated the pharmacokinetic properties of TDP in the form for oral administration in two animal species — rats and rabbits.
Material and methods
Drug products under study
TDP in the form of enteric coated tablets, 5 mg, developed and produced at the JSC Institute of experimental pharmacology (Russia) after the original technology [9] with the substance H-Tyr-D-Arg-Phe-Gly-D-Arg-D-Arg-D-Arg-D-Arg-D-Arg-D-Arg-D-Arg-D-Arg-Gly-OH•10HCl (CJSC “Innovation Research and Production Center “PEPTOGEN”, Russia) was the object of the study.
Experimental animals and design
Pharmacokinetics research (in vivo experiments) was carried out on male rabbits and male rats (“RMC “HOME OF PHARMACY”, Russia). The experiments were performed in accordance with the methodological guidelines [10–12] and regulatory documents [The laboratory practice rules for preclinical studies in the Russian Federation (GOST 33044–2014); directive 2010/63/EU of the European Parliament and Council of the European Union of 22.09.2010 on the protection of animals used in the scientific purposes, etc.] for preclinical studies using laboratory animals; the experiments were also approved at a session of the bioethical committee (No. 2.34/17 of 07.06.2017).
The drug was administered to the rats intragastrically (this way is equivalent to oral administration) once in the doses 10, 25 and 50 mg/kg and repeatedly at a dose of 25 mg/kg (once a day for 3 days), to the rabbits — orally once in the doses 5, 12.5 and 25 mg/kg. Because of animal features, tablets were administered to rats as a suspension in an inert carrier (1% amylum solution); to rabbit tablets were administered whole, without disintegration. Additionally, the TDP substance (in the form of solution in water for injections with concentration of 1 mg/ml) was administered intravenously once in a dose of 1 mg/kg to determine the absolute bioavailability in rats and rabbits.
The distribution of the animals into experimental groups was performed by modifying block randomization [13, 14]. For the pilot experiment, the rats were distributed into 1 group containing 15 animals, later divided into 5 subgroups by the number of time points, with 3 animals in each subgroup. For the main experiment, the rats were divided into 6 groups: 4 groups of 6 animals in each group and 1 group of 50 animals (this group was further divided into 10 subgroups by the number of time points, with 5 animals in each subgroup because of euthanasia was necessary for sample collecting); the rabbits were divided into 4 groups of 6 animals in each group.
Blood samples from rats and rabbits were taken 0 (before administration), 0.25, 0.5, 0.75, 1, 2, 4, 6, 8 and 24 hours after the administration; in the pilot experiment in the rats, the time points were 0, 0.5, 1, 2 and 6 h, with heparin used as an anticoagulant. The blood samples were collected from the rat tail vein or from the rabbit marginal ear vein, through an intravenous catheter (22G, KD Medical GmbH Hospital Products, Germany) in a volume of 0.3 ml for rats or 2.0 ml for rabbits at each time point. For the rats in the pilot experiment and in the main experiment after a single intragastrical administration in a dose of 25 mg/kg, the blood samples were collected from the heart during euthanasia in a CO2 camera simultaneously with sampling tissue in the volume of 2.0 ml at each time point. The samples were centrifuged to obtain blood plasma (15 min, 3000 rpm); the resulting plasma was frozen and stored at –20 °C.
Five tissues (liver, kidneys, spleen, muscle, brain) were selected to assess the tissue distribution, in rats administered once in a dose of 25 mg/kg (at ten time points simultaneously with blood sampling, manipulation was accompanied by euthanasia of animals) and two types of excretes (urine and feces, at 5 times intervals, sampling was performed using metabolic cells). The obtained samples of tissues and feces were placed in grippers, weighed and frozen. The volume was measured for the urine samples, and the samples were also frozen. All the samples were thawed before an analysis and utilized after analysis (without repeated froze/thraw cycles).
Biosample analysis
TDP quantification was done by an enzyme immunoassay method with the commercially available reagent kit [Elisa kit for 1‑Deamino 8D-Arginine Vasopressin (DDAVP), Cloud Clone Corp., USA]. Manufacture’s recommendations to the reagent kit [15] were used as the base for assay with some changes made to the TDP definition.
All reagents were maintained at room temperature for 30 minutes before use. The calibration sample was dissolved in 100 μl of solvent the calibration sample (standard diluent from reagent kit). Then, a series of dilutions of calibration solution concentrations 100 ng/ml, 33.3 ng/ml, 11.1 ng/ml, 3.70 and 1.24 ng/ml was prepared after reagent kit recommendations [15]. The detection reagents A and B were dissolved in the corresponding solvents in a ratio of 1:100. To prepare the working wash buffer solution, 20 ml of the concentrated solution was mixed with 580 ml of purified water. The TMB substrate and stop reagent included in the kit were ready for use.
TDP solutions in standard diluent from a reagent kit with concentrations of 0.01–100 μg/ml were used to prepare model mixtures with biomaterial and perform necessary validation tests. Calibration model mixtures with blood plasma of the intact animals (rats and rabbits), as well as rat tissue homogenates (liver), were prepared to construct a calibration curve for TDP concentration in biomaterial. Briefly, 60 μl of TDP solutions with various concentrations were added to 540 μl of intact blood plasma or liver homogenate. To obtain a calibration sample with a concentration of 0 μg/ml (blank sample) 60 μl of standard diluent was added to 540 μl of blood plasma or homogenate. The plasma model mixtures were then vigorously stirred at 2000 rpm for 60 seconds and stored at a temperature of 2–8 °C for 3 days. The tissue model mixtures were then vigorously stirred at 2000 rpm for 60 seconds and centrifuged at 6000 rpm for 15 minutes (Hermle Labortechnik, Germany), and the supernatant was used for analysis.
To obtain a tissue homogenate of an organ (liver, kidneys, spleen, brain) the organ was placed in a plastic tube, weighed, homogenized with a Polytron PT-MR 1600E tissue grinder (Kinematica AG, Switzerland) with 0.01M phosphate-salts buffer solution (JSC Rosmedbio, Russia) in mass: volume ratio 1:10. To 1 ml of the resulting homogenate 1 ml of purified water was added, the sample was vortexed for 30 seconds, then centrifuged at 3000 rpm for 15 minutes, an aliquot was taken to determine the TDP concentration. When treating muscle, an additional stage of trituration with glass sand was used.
50 μl of each calibration solution/TDP solution/model mixture/analyzed plasma samples or homogenates were added to the wells of the plate (not less than 2 parallel repeating was analyzed for each sample). Then, 50 μl of detection reagent A was applied to all wells. The stripes were sealed with a film. The contents of the cells were stirred at 25 °C at 700 rpm (incubator-shaker 3‑STL, Elmi, Latvia). The plates were then placed in a refrigerator and incubated at 2–8 °C “over night”. At the end of incubation, the contents of the wells were removed and the plate washed 3 times, adding 350 μl of wash buffer to each well.
At the end of the washing, the moisture residues from the wells were carefully removed by tapping an inverted plate on the filter paper.
Then, 100 μl of detection reagent B solution was added to all wells and incubated for 30 minutes at 37 °C at 700 rpm (incubator-shaker 3‑STL, Elmi, Latvia). At the end of incubation, the contents of the wells were removed and the plate was washed with washing buffer solution 5 times with 350 μl portions.
At the end of the washing, all wells were injected with 90 μl of TMB substrate and in-cubed at 18–25 °C for 15 minutes in the dark. At the end of incubation, 50 μl of the stop reagent was added, stirred on a shaker at 700 rpm for 30 seconds (incubator-shaker 3‑STL, Elmi, Latvia), and the optical density of the solutions in the strip wells on the plate spectrophotometer (xMarkTM Microplate Spectrophotometer, Bio-Rad, USA) was measured at 450 nm.
To calculate the concentration of TDP in blood plasma and other types of biomaterial, the following calculations were done:
- mean values for optical density (D) at 450 nm were calculated for each sample;
- values for calibration samples and analyzed samples (D) were divided into value for the blanksample (D0) and the parameter D/D0 was calculated;
- for calibration curve linearization parameters logit(D/D0)=ln[(1D/D0)/(D/D0)] was calculated;
- calibration curve for lgC=f(logitD/D0) was plotted, where the C — DDAVP concentration, ng/ml; these calibration curves were obtained after analysis of calibration samples from the reagent kit and used for calculation of the logarithm of DDAVP concentration for model mixtures of plasma or tissue homogenate with TDP addition and analyzed samples;
- then the calibration curve (type y=ax+b) was plotted between the logarithm of DDAVP concentration (y=lgC, ng/ml for plasma or ng/g of tissue), calculated for model mixtures and TDP standard solutions, and the logarithm of TDP concentration (x=lgCTDP, μg/ml or μg/g). After these curves lg CTDP and then CTDP values (for plasma in μg/ml, for tissue in μg/g of tissue) were calculated for each analyzed sample obtained from animals. If necessary, dilution factors of the analyzed sample were taken into consideration.
Statistical analysis
The pharmacokinetics parameters were calculated from a model-independent method of statistical moments [16] using the PKSolver application for Microsoft Office Excel; mean arithmetic values (𝑋̄), their corresponding standard deviations (SD), standard errors of the mean value (S𝑥̄) were calculated. For statistical estimation of the differences between pharmacokinetic parameters, a one-way ANOVA analysis of more than two groups or t-test for the mean values (for two groups) was performed; the assessment was carried out at 95% confidence level with parametric or non-parametric criteria in depending on the normality of distribution. A statistical analysis of the results was performed using Microsoft Office Excel 2007 and GraphPad Prism 9 (GraphPad Software, USA).
Results
Bioanalytical assay development and partial validation
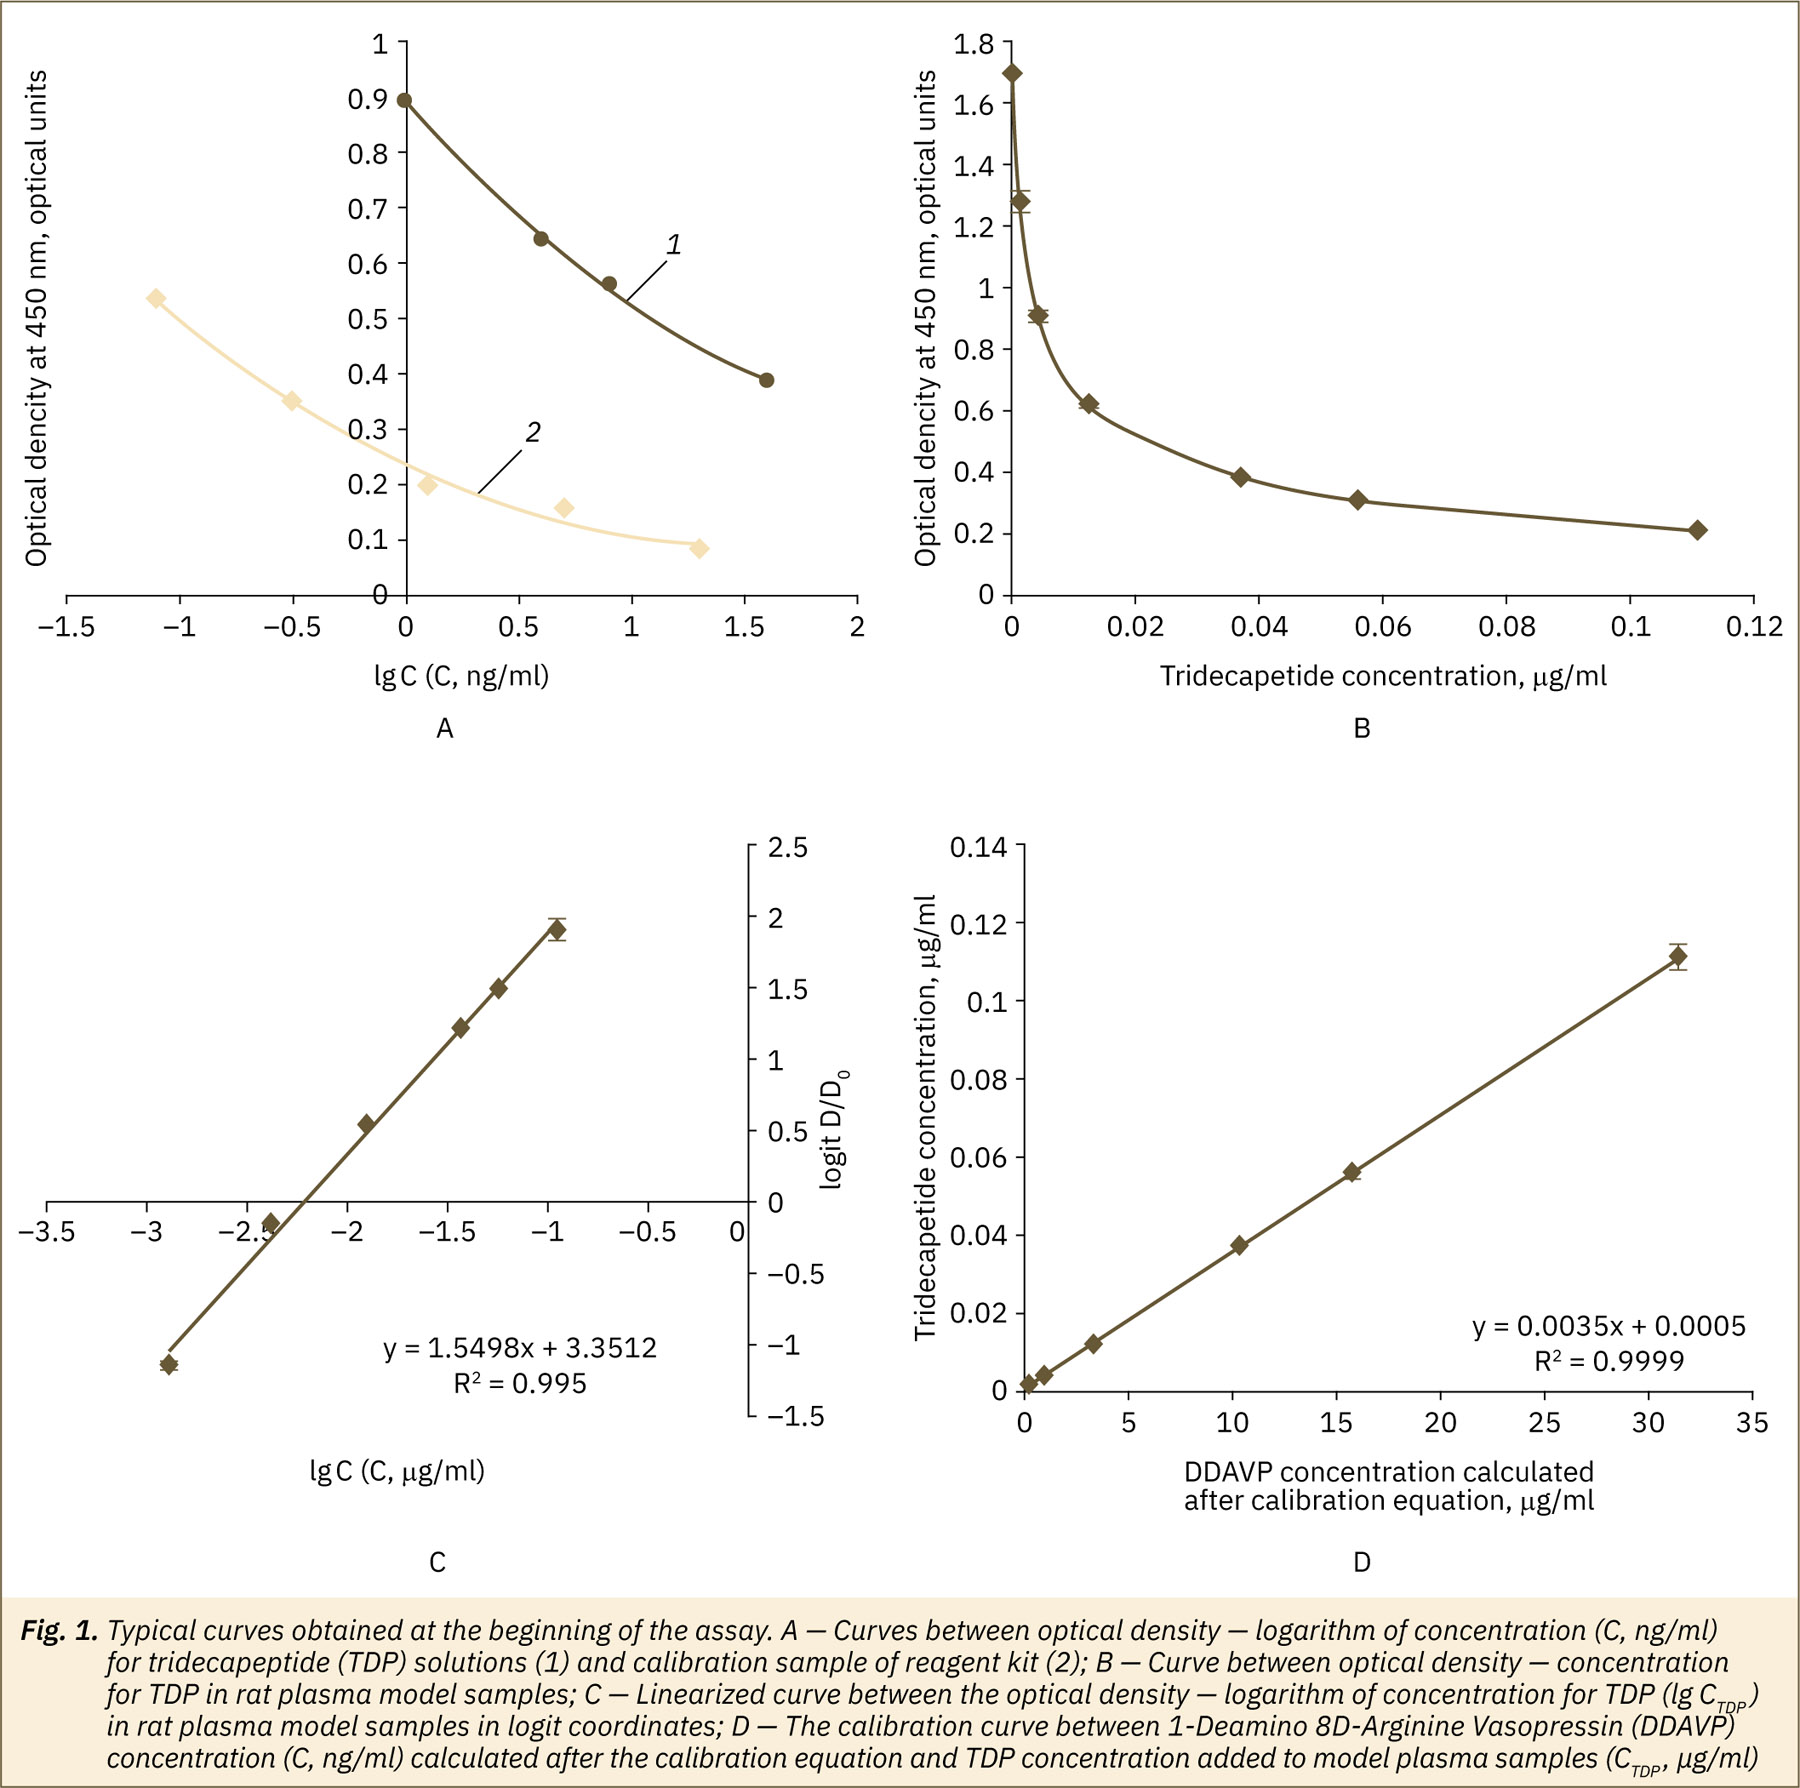
A few typical curves obtained at the approbation stage are presented in fig. 1. The curve obtained for a calibration sample from a reagent kit was typical for competitive enzyme immunoassay method results confirmed the correctness of the method setting in our laboratory. For TDP substance solutions, inversely proportional dependence between optical density and TDP concentrations (in range 1.0–40 ng/ml) was similar to those for calibration samples from a reagent kit (fig. 1A). After these data reagent kits may be used for TDP analysis in the same way as for the DDAVP. After analysis of model mixtures of animal plasma with TDP additions, the linearity of the assay for TDP was found in the range 0.001–0.111 μg/ml (fig. 1B, 1C). Similar data were obtained after analysis of model mixtures of tissue (liver homogenate) with TDP additions; the linearity of the assay for TDP was found in the range 0.14–10 μg/ml. An example of the final calibration curve between the logarithm of DDAVP concentration and the logarithm of TDP concentration used for final calculations for plasma is presented in figure 1D. Similar results were obtained from tissues.
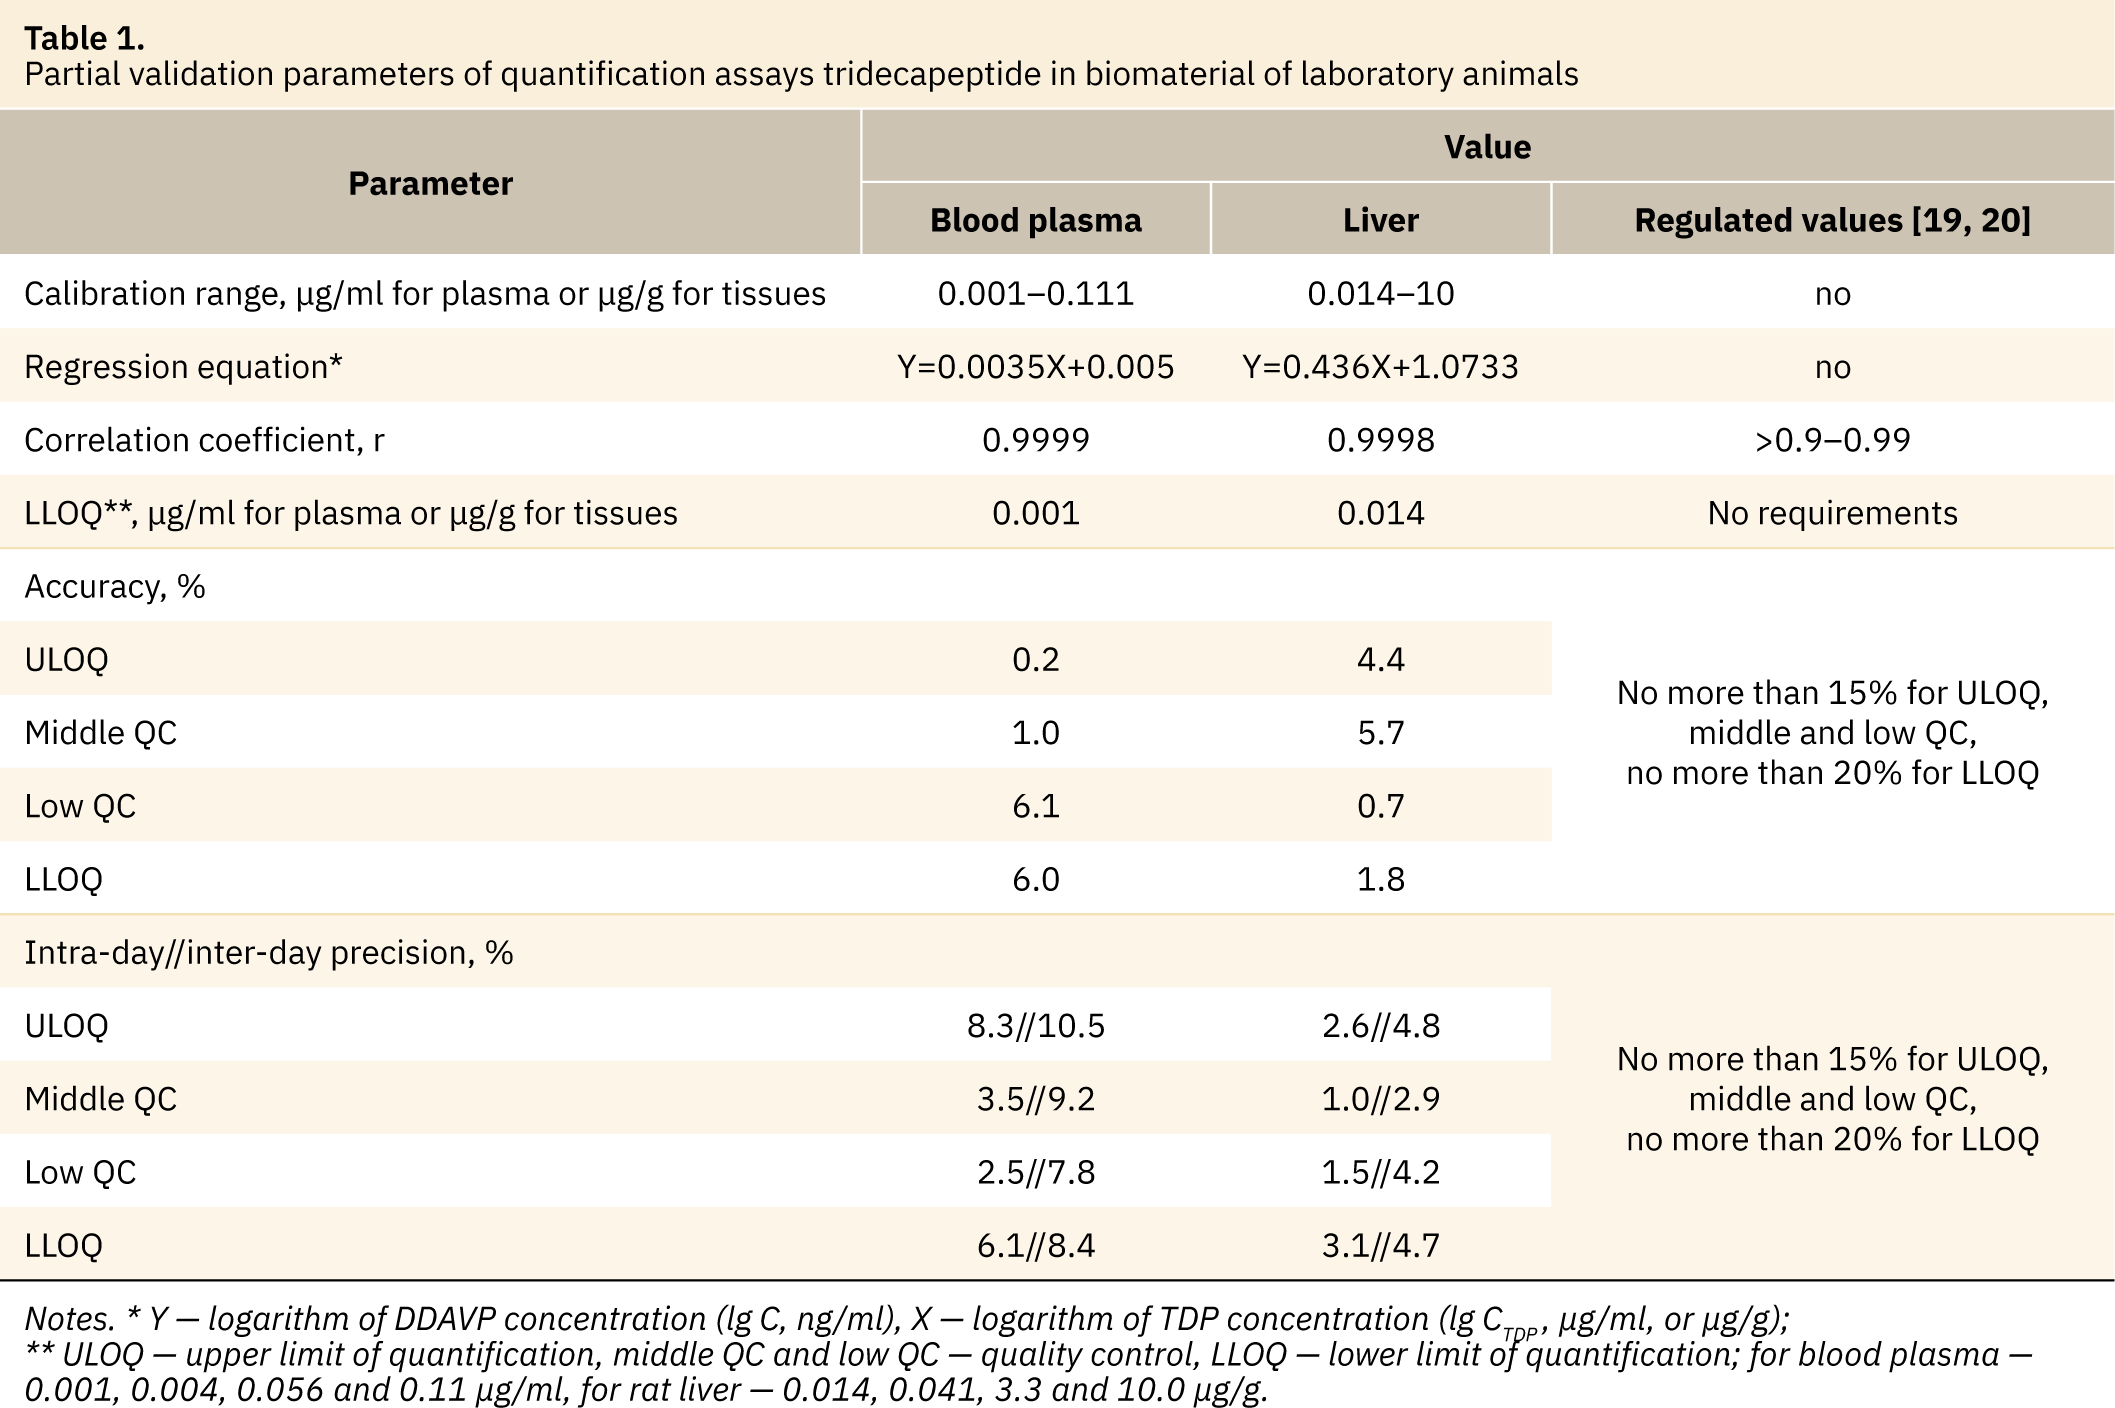
For further application, assays for TDP quantification in the laboratory animal’s blood plasma and tissues (in example of the liver) were properly validated according to the official recommendations [17–20]. The main partial validation parameters are presented in Table 1. Satisfactory results were obtained for all checked parameters.
Plasma pharmacokinetics in two animal species, linearity of pharmacokinetics and TDP absolute bioavailability
Biological samples obtained during the animal experiment were analyzed via proposed and validated assays.
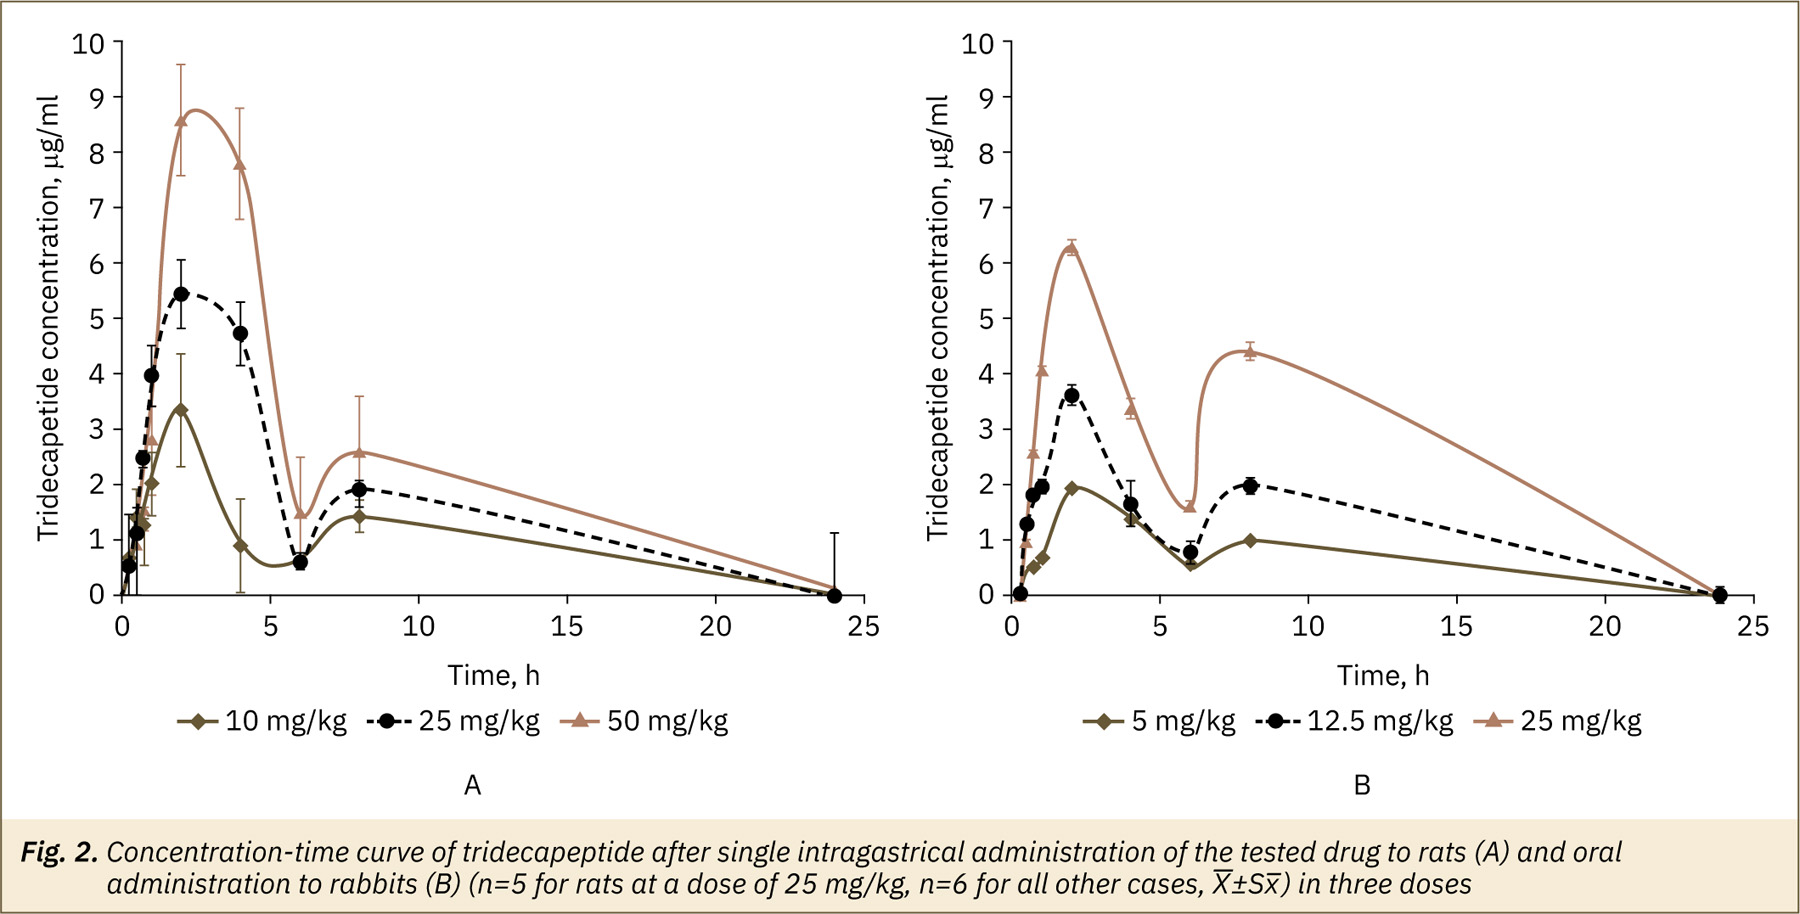
The TDP kinetics curves in blood plasma after testing drug administration at three different doses (fig. 2) were similar and typical for oral administered drug forms. The maximum plasma concentration of the active ingredient for all doses was found in 2–3 hours after administration. Further, TDP concentration was decreased and secondary less pronounced rise of about 8 hours was observed. The TDP content in the rat’s blood plasma after 24 hours of the experiment was less than LLOQ for doses 10 and 25 mg/kg and about 1.5% of the maximum-detected concentration for dose 50 mg/kg, in the rabbit’s plasma analyte was not detected at the time point 24 hours.
Pharmacokinetic parameters of the tested drug after administration in rats and rabbits are presented in Table 2.
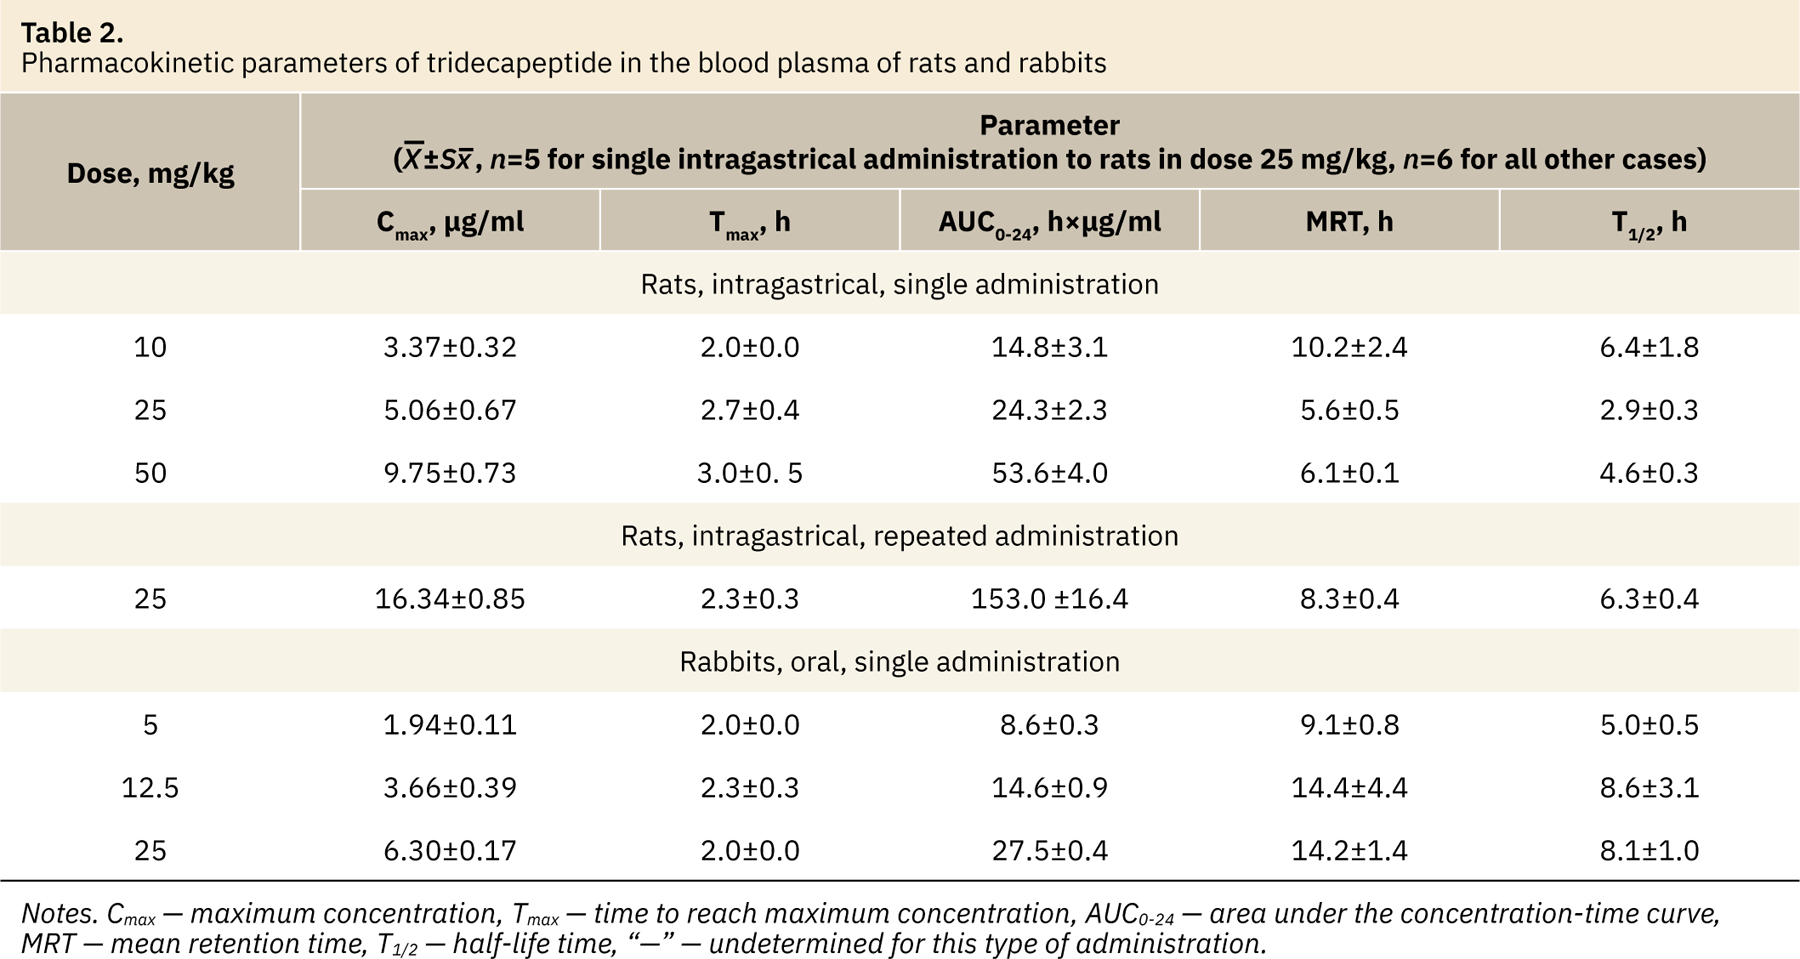
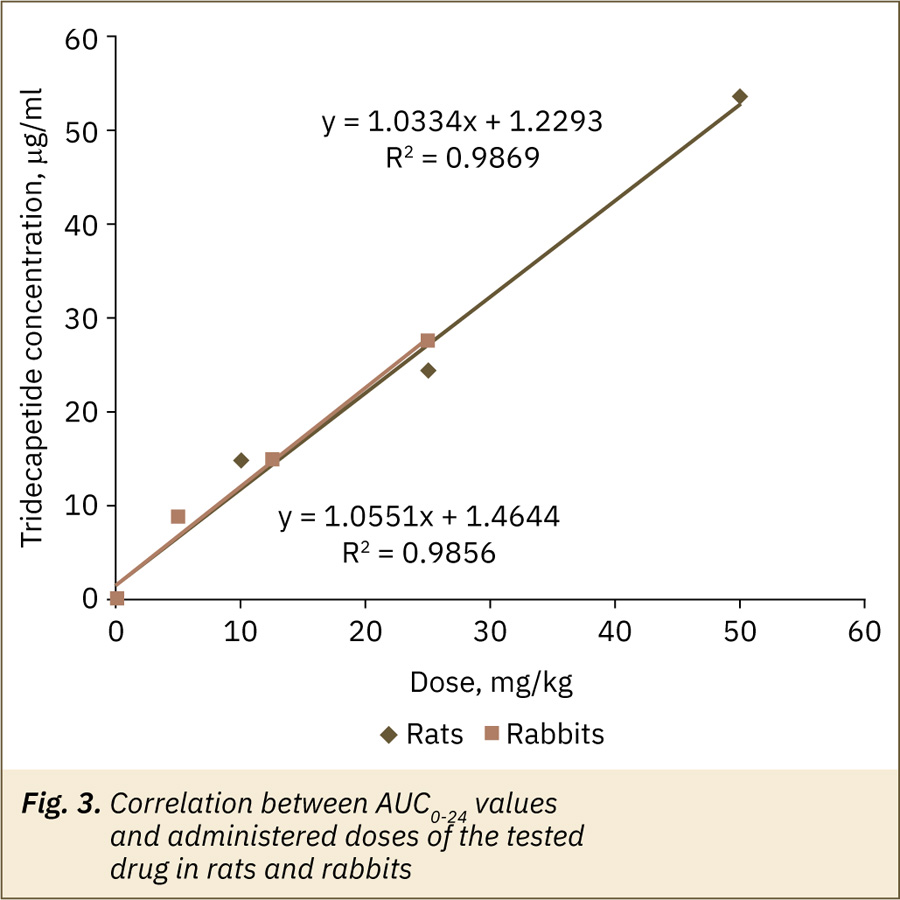
The maximum plasma concentration (Cmax) values had statistically significant differences [for rats F(2,14)=32.38, for rabbits F(2,15)=74.62, p<0.0001, one-way ANOVA with Tukey’s test, factor “TDP dose”] depending on a dose of the administered drug. The average value of this parameter increased in 1.5–1.9 times in the rats and rabbits with an increasing the dose. The main parameter characterizing the degree of drug bioavailability, AUC0-24, also had statistically significant differences [for rats F(2,14)=38.89, for rabbits F(2,15)=285.8, p<0.0001] between the values for all study doses for the two animal species under study. The average value of AUC0-24 increased in 1.6–2.2 times in rats and 1.7–1.9 times in rabbits with the dose increasing. The linear increase in AUC0-24 values in rats and rabbits was observed (fig. 3).
Time to maximum concentration (Тmax) was about 2–3 hours for rats and about 2–2.3 hours for rabbits; mean retention time (MRT) — were about 5.6–10.2 hours for rats and 9.1–14.4 hours for rabbits; half-life period values (T1/2) mean values varied from 2.9 to 6.4 hours for rats and from 5.0 to 8.6 hours for rabbits. For these parameters the differences between the groups receiving different doses of the drug were statistically insignificant (one-way ANOVA, Kriskal-Wallis test with Dunn’s multiple comparison, p>0.05) or identified statistical differences (for rats in T1/2 values between doses 10 and 25 mg/kg, for rabbits — in MRT values between doses 5 and 25 mg/kg) are likely due to animal’s individual features, small group sizes and are not expected to have clinical significance.
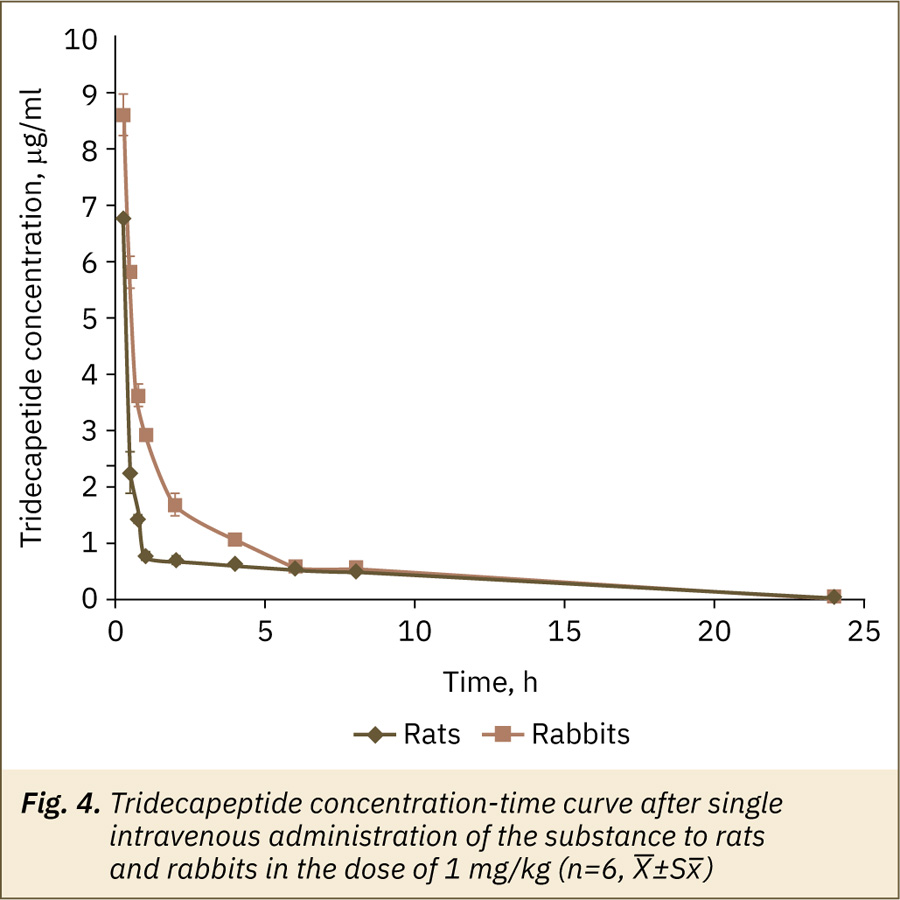
The maximum plasma concentration of the active ingredient after a single intravenous administration of the substance to rats and rabbits in dose 1 mg/kg was found at the first time point after administration; then a quick decrease in the TDP plasma concentration was observed (fig. 4). After 8 hours of the experiment, the TDP content in the rat’s blood plasma was less than 7% of the maximum-detected concentration, in the rabbit’s plasma — about 6% of maximum concentration, at the time point 24 hours analyte was not detected in plasma samples for both animal species. Calculated AUC0-24 values were 9.5±0.4 h×μg/ml for rats and 14.2±0.4 h×μg/ml for rabbits. The absolute bioavailability of TDP after oral administration in relation to intravenous administration was about 10.2–15.6% in rats and 7.7–12.1% in rabbits.
Repeated dose pharmacokinetics
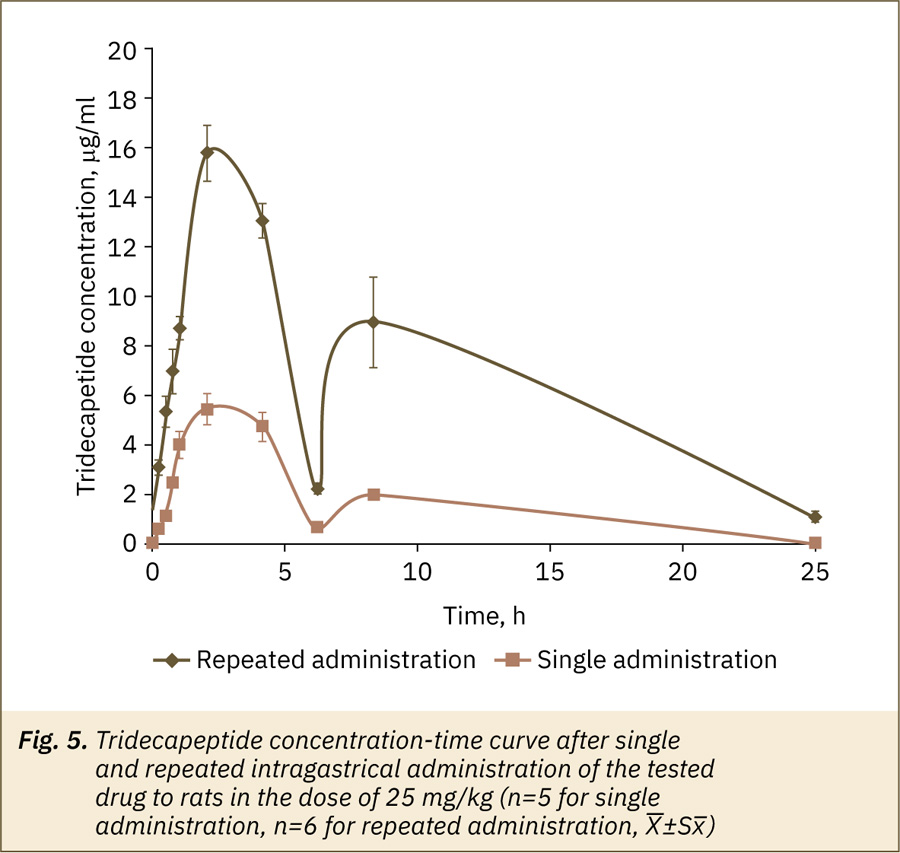
The main goal of pharmacokinetics research with repeated drug administration is to clarify its ability to accumulate in the body. Since the linearity of pharmacokinetics was determined in the experiment with a single administration, one dose — 25 mg/kg, was used for repeated administration, with the drug administered once a day for 3 days.
The kinetics of TDP in blood plasma after repeated and single tested drug administration were similar (fig. 5) but active ingredient concentrations for some time points were higher after repeated application. The values of the main pharmacokinetic parameters — Cmax, AUC0-24 (Table 2) had statistically significant differences (unpaired t-test, p>0.05) after repeated and single administration. For MRT, T1/2, Тmax no significant differences (Mann–Whitney test, p>0.05) were observed. Thus, the possible accumulation of an active substance after testing drug oral administration is suggested.
Tissue availability and excretion
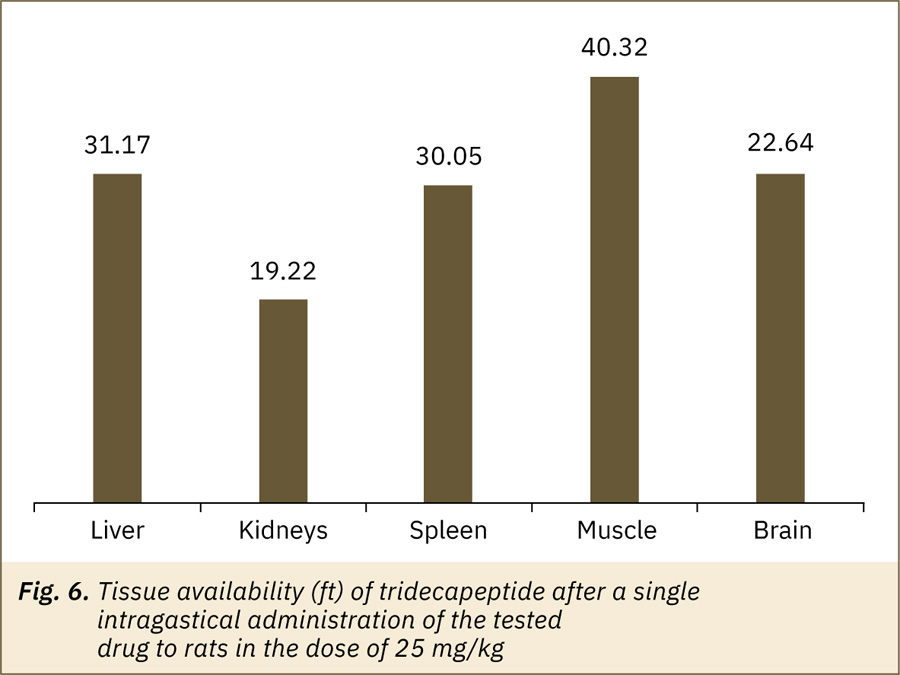
The tissue availability of the drug is an important step in pharmacokinetic studies. The main result of the distribution process is the drug transport to the area of action, where it interacts with structures that determine the effect of the drug. The intensity of penetration of the pharmacological agent into peripheral tissues should be characterized by tissue availability (ft), defined as the ratio of the tissue AUC value (AUCT) to the corresponding plasma AUC value, as well as the value of the half-life and mean retention time (T1/2, T, and MRTT) [10]. The main parameters characterizing the TDP penetration into the liver, kidneys, spleen, muscle and brain are presented in Table 3.
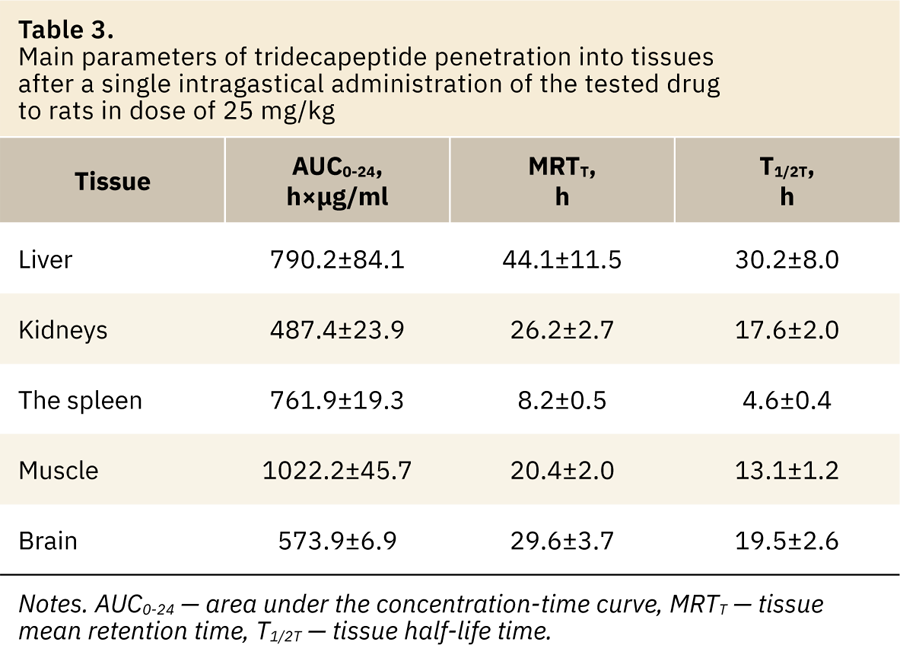
The TDP tissue availability values (ft) for the tested tissues were 19.2–40.3 (fig. 6). The high concentration of active substance was observed in all tested tissues; maximum — in muscle, liver and spleen, minimum — in the kidneys.
TDP was found in urine and feces samples; its maximum concentration in urine was observed in the interval of 2–4 hours after a single administration of the tested drug in dose 25 mg/kg. In total, about 0.2% of TDP was removed from the rat’s body in 24 hours with the urine experiment and about 1.2% with feces. After literature data, the kidneys are the major elimination organ for peptides and proteins if they are smaller than the glomerular filtration limit of ∼60 kDa [21].
Discussion
The peptide drug pharmacokinetics is a special analytical task. Chromatography (high performance liquid chromatography with ultraviolet or mass-spectral detection) methods and enzyme immunoassay methods can be used to determine different peptide compounds content in various objects, including biological samples [22–25]. Wide scientific discussion in the field of possibilities of these two analytical dimensions and examples of two approaches comprised for various compounds may be found in the literature [26–31]. Most authors agree that mass spectrometry is not sensitive enough and difficult (more expensive in equipment buying and exploitation, requires higher staff qualifications, etc.) while the immunoassay methods have certain advantages due to the high sensitivity and use of specific antibodies against the analyte [28, 31]. Immunoassays tend to be cheaper and faster when reagent kits are available; but they are rather difficult and expensive to develop [28, 31].
One more analytical method may be based on biological markers (biomarkers, pharmacodynamics, response biomarker, or surrogate endpoint) approach [32, 33]. Such approaches may be proposed on the knowledge of the mechanism of action, the point of application, the pharmacodynamics response of a drug under study. A biomarker approach may be effective for individual compounds (including synthetic peptides) and complex mixtures, endogenous or rapidly metabolizing compounds when it is difficult or impossible to analyze them with classical chromatographic methods [34, 35]. The biomarker choice is not a simple task and if it is possible to create or adapt a commercially available reagent kit (for the enzyme immunoassay method, for example) it will be preferable to solve a particular analytical problem.
There are no commercially available reagent kits with antibodies specific to the TDP. However, reagent kits for 1‑deamino-8D-arginine-vasopressin (DDAVP) quantification in biosamples are available. DDAVP is a synthetic hormone with a chemical structure close to the target analyte (TDP). TDP and DDAVP have a common fragment in their structures — D-arginine. This fact allows us to assume that the antibodies used in the reagent kit for DDVAP can have cross specificity, and it is possible to define the TDP concentration in biological samples using this kit. The experience of commercial reagent kit adaptation for the analysis of protein nature compound with a similar structure (on example of darbopoetin analysis with the kit for erythropoietin) was previously reported [36]. This study is one more successful example of such cross-application of ready-to-use reagent kits. This way is much simpler and cheaper than the new kit with a specific antibody development.
The ability of the proposed assays for quantification of target analyte in biosamples after drug administration was confirmed after a pilot experiment. Also, the total period of observation and sampling design was optimized by minimization the number of experimental animals. A small sample volume was enough for a bioanalytical assay and it appears possible to obtain blood samples not after euthanasia but from the rat’s tail vein. Thus, animals were kept alive and returned to the stock population after the experiment. This case is one more example of the pilot study’s importance in bioethical, design and analysis aspects for such analytes and analytical approaches in the same way as we mentioned previously [35, 37]. The main study covered all important aspects that are necessary to characterize the original drug pharmacokinetics [5, 10].
Peptide drugs have several drawbacks associated with their structure and pharmacokinetics characteristics. These include large molecule size, high hydrophility and, as a result, low permeability to tissue, metabolic instability (enzymatic degradation and susceptibility to hydrolysis in the acidic environment of the gastrointestinal tract), short half-life, rapid metabolism and high clearance, immunogenicity. As a consequence, in the oral administration of peptide preparations, the absolute bioavailability level reaches in most cases only 1% [6, 21]. In comparison with this information, our results are very successful and encouraging (fig. 2) because we observed much higher absolute bioavailability of TDP — not less than 7.7%. Oral delivery of peptides may be the preferred route of administration because this way is convenient and pain-free [21]. As it was proposed previously [4] the synthetic tetrapeptide modification by the addition of poly-arginine tail improved protease resistance and penetration properties of TDP. It is important to emphasize that the antinociceptive effect of TDP in mice in the writing test was comparable to that of morphine, especially after oral administration [4]. The authors underlined that the modified molecule became stable enough to provide an analgesic effect after oral administration [4]. This statement is in accordance with pharmacokinetics study results.
It is difficult to unambiguously explain the appearance of the second maximum on concentration-time curves (fig. 2, 5). The second maximum may be related to the investigated drug true behavior and, for example, its secondary release into the blood. Alternatively, TDP can induce secondary processes that release arginine-containing compounds into the bloodstream. This illustrates a disadvantage of the proposed approach and enzyme immunoassay methods in general are associated with their not enough specificity [31].
Tissue analytical data suggest an intensive distribution of TDP into tissues with various vascularization — liver, kidneys and spleen are examples of high vascularized tissues, muscle — moderately vascularized tissue; the liver and kidneys are also responsible for intensive metabolism, subsequent excretion and may be important from the view of the toxic effect of the study drug. The brain is a possible target tissue where pharmacological (analgesic) action may be realized and the fact of blood-brain barrier (BBB) penetration is essential for drug candidate characterization.
By opinion reported in review [21] after peptide intravenous application the plasma concentration-time profile can be best described by a two compartment pharmacokinetic models where the “central compartment is represented by the vascular space and the interstitial space of well-perfused organs with permeable capillary walls (especially the liver and kidneys), while the peripheral compartment comprises the interstitial space of poorly perfused tissues such as the skin and muscle”. Obtained data on intensive TDP penetration into the liver, kidneys and muscles are consistent with this opinion.
TDP by its chemical structure is relative to dermorphin, which is known as one of the pharmacologically active opioid peptide with high brain and plasma stability, transported into the brain without trapping in the cerebral vasculature and without efflux [38]. Improved BBB penetration has also been reported for some glycosylated opioid peptides [39] and esterificated demorphin derivatives [40]. Probably, TDP has similar properties. Also, oligoarginine vectors increase cell and BBB penetration [41–43]. Poly-arginine tail causes changes in hydrophilic-hydrophobic properties and steric confirmation of the molecule that result in its interaction with mu- and kappa-opioid receptors and improves peptide bioavailability after non-injection administration [4].
It is difficult to compare obtained results with literature pharmacokinetic data for other opioids and/or (poly) arginine peptides because of quite few publications in this field. Additional restrictions are caused by differences in study compounds, biological test systems, administration routes, ets. Thus, Szeto et al. [44] reported pharmacokinetic data for two peptides (H-Tyr-D-Arg-Phe-Lys-NH2 and H-Dmt-D-Arg-Phe-Lys-NH2) after their intravenous administration in sheep (Robinson et al. [45]), studied desmophin in horses also after intravenous administration (Chiu et al. [46]) published results of tissue distribution of radio-labeled poly-arginine peptide administered intravenously. It is interesting to mention, that the same tissues as in this study were tested, the highest concentration was detected in the kidneys, the lowest — in the brain [46].
Possible TDP accumulation after repeated administration could serve as a basis for its toxicokinetics study. Such studies provide a comparison of toxicokinetic parameters and signs of intoxication after a single and repeated administration of the drug not only at therapeutic but also at significantly higher (potentially toxic) doses. It is necessary to mention that TDP shows a stable analgesic effect and decreased tolerance to morphine in chronic pain models in 7‑day treatment experiments [4]. This is the great and promising advantage of this drug. No negative clinical manifestations were observed during these pharmacological experiments as in the case of this pharmacokinetic experiment.
Conclusion
The pharmacokinetics parameters of new analgetic tridecapeptide with an octaarginine vector in the form for oral application were evaluated, including absorption after a single administration in three doses in two types of animals, linearity of pharmacokinetics and absolute bioavailability, distribution to tissues, excretion with two types of excretes, as well as evaluation of pharmacokinetics at repeated administration in one dose.
The pharmacokinetics of the drug was found to be linear after a single administration of the TDP drug in the dose range of 10–50 mg/kg for rats and 5–25 mg/kg for rabbits. The absolute bioavailability of the TDP after oral administration was about 8–16%.
The active substance was intensively distributed into highly vascularized tissues (spleen), tissues, providing metabolism and excretion (liver and kidneys), moderately vascularized tissues (muscle). The ability to penetrate the blood-brain barrier was proposed since TDP was found in the brain.
About 0.2% of TDP was removed from the rat body in 24 hours with the urine and about 1.2% with feces; repeated administration shows its possible accumulation.
The study included all the main areas necessary to characterize the original drug’s pharmacokinetics.
Conflict of interest
The authors declare no conflict of interest.
Authors contribution
V.M. Kosman — research planning and conduction, pharmacokinetic parameters calculation, results analysis and discussion, manuscript text and illustrations preparing.
N.M. Faustova — bioanalytical assay development, experimental analytical work evaluation.
M.V. Karlina — result discussion, manuscript text preparing.
V.G. Makarov — critical analysis of study results and final manuscript text.
M.N. Makarova — critical analysis manuscript text and illustrations.
References
-
Rosenblum A., Marsch L.A., Joseph H., Portenoy R.K. Opioids and the treatment of chronic pain: controversies, current status, and future directions // Exp. Clin. Psychopharmacol. 2008. Vol. 16. N. 5. P. 405–416. DOI: 10.1037/a0013628.
-
Chaki K., Kawamura S., Kisara K. et al. Antinociception, and physical dependence produced by [D-Arg2]-dermorphin tetrapeptide analogs and morphine in rats // Br. J. Pharmacol. 1988. Vol. 95. N. 1. P. 15–22. DOI: 10.1111/j.1476-5381.1988.tb16543.x.
-
Chaki K., Sakurada S., Sakurada T. et al. Comparison of the antinociceptive effects of new [D-Arg2]-dermorphin tetrapeptide analogs and morphine in mice // Pharmacol Biochem Behav. 1988. Vol. 31. N. 2. P. 439–444. DOI: 10.1016/0091-3057-(88)90371-1.
-
Kashkin V.A., Shekunova E.V., Titov M.I. et al. A new tridecapeptide with an octaarginine vector has analgesic therapeutic potential and prevents morphine-induced tolerance // Peptides. 2018. Vol. 99. P. 61–69. DOI: 10.1016/j.peptides.2017.11.011.
-
WHO Guidelines for the Pharmacological and Radiotherapeutic Management of Cancer Pain in Adults and Adolescents. Geneva: World Health Organization; 5, Cancer Pain Management Guiding Principles. 2018. URL: https://www.ncbi.nlm.nih.gov/books/NBK537483/ (06.2022).
-
Hassani L.N., Levis A., Richard J. Oral peptide delivery: technology landscape & current status // OndrugDelivery. 2015. Vol. 59. P. 12–17. URL: https://www.ondrugdelivery.com/wp-content/uploads/2017/05/Ipsen_HR.pdf (06.2022).
-
Lewis A.L., Richard J. Challenges in the delivery of peptide drugs: an industry perspective // Ther. Deliv. 2015. Vol. 6. N. 2. P. 149–163. DOI: 10.4155/tde.14.111.
-
Morishita M., Peppas N.A. Is the oral route possible for peptide and protein drug delivery? // Drug Discov Today. 2006. Vol. 11. N. 19–20. P. 905–910. DOI: 10.1016/j.drudis.2006.08.005.
-
Patent RU 2669386C1 Composition and method for producing peptide analgetic agent. 2017. URL: https://patents.google.com/patent/RU2669386C1/en (06.2022).
-
Guidelines for preclinical drug research. Part one. M.: Grif and K. 2012. P. 845–855. URL: https://www.regmed.ru/
Content/Page.aspx?id=30e5e2b2-74a6‑4616‑9624‑b796f00d0a9b (In Russ.).
-
ICH M3 (R2) Non-clinical safety studies for the conduct of human clinical trials for pharmaceuticals. Step 5. EMA/CPMP/ICH/286/1995. 26 p. 2013. URL: https://www.ema.europa.eu/en/ich-m3‑r2‑non-clinical-safety-studies-conduct-human-clinical-trials-pharmaceuticals (06.2022).
-
Guidelines for the examination of medicines. Volume I. M.: Griff and K. 2013. P. 6–44. URL: https://lit-review.ru/guides/expertise_vol1.pdf (In Russ.).
-
Altman D.G., Bland J.M. How to randomize // BMJ. 1999. Vol. 319. N. 7211. P. 703–704. DOI: 10.1136/bmj.319.7211.703.
-
Bland M. An Introduction to Medical Statistics (3rd edition). Oxford Medical Publications. 2000. 422 р.
-
Enzyme-linked Immunosorbent Assay Kit for 1‑Desamino 8D Arginine Vasopressin (DDAVP). Instruction manual. URL: http://www.cloud-clone.com/manual/ELISA-Kit-for-1‑Desamino-8D-Arginine-Vasopressin--DDAVP--E91841Ge.pdf (06.2022).
-
Zhang Y., Huo M., Zhou J., Xie S. PKSolver: An add-in program for pharmacokinetic and pharmacodynamic data analysis in Microsoft Excel // Computer Methods and Programs in Biomedicine. 2010. Vol. 99. N. 3. P. 306–314. DOI: 10.1016/j.cmpb.2010.01.007.
-
ICH Q2A, Harmonized tripartite guideline, text on validation of analytical procedures IFPMA Proceedings of the International Conference on Harmonization, Geneva. 1994. 10 p. URL: https://www.fda.gov/media/71724/download (06.2022).
-
ICH Q2B, Harmonized tripartite guideline, validation of analytical procedure: methodology IFPMA Proceedings of the International Conference on Harmonization, Geneva. 1994. 13 p. URL: https://www.fda.gov/media/71725/download (06.2022).
-
Guideline on bioanalytical method validation. EMEA/CHMP/EWP192217/2009, London, Committee for medicinal products for human use (CHMP). 2011. URL: https://www.ema.europa.eu/en/documents/scientific-guideline/guideline-bioanalytical-method-validation_en.pdf (06.2022).
-
Guidance for Industry: Bioanalytical method for validation. Rockville, MD, U.S. Department of Health and Human Services, FDA, Center for Drug Evaluation and Research, Center for veterinary medicine. 2018. 41 p. URL: https://www.fda.gov/files/drugs/published/Bioanalytical-Method-Validation-Guidance-for-Industry.pdf (06.2022).
- Rathi C., Meibohm B. Pharmacokinetics of Peptides and Proteins. Reviews in Cell Biology and Molecular Medicine, R.A. Meyers (Ed.). 2015. DOI: 10.1002/3527600906.mcb.200400105.pub2.
- Ali Q., Wu Y., Nag S., Hussain T. Estimation of angiotensin peptides in biological samples by LC/MS method // Anal. Methods. 2014. Vol. 6. N. 1. P. 215–222. DOI: 10.1039/C3AY41305E.
-
Bode G.H., Pick K.E., Sanchez-Purrà M. et al. European NanoBioPharmaceutics Research Initiative. Detection of Peptide-based nanoparticles in blood plasma by ELISA // PLoS One. 2015. Vol. 10. N. 5. P. e0126136. DOI: 10.1371/journal.pone.0126136.
-
Chen Y., Liu Y. Analytical Methods for the Determination of Anti-diuretic Peptides in Biological Samples: Challenges and Perspectives // Current Analytical Chemistry. 2011. Vol. 7. N. 2. DOI: 10.2174/157341111794815048.
-
Yang Y., Boysen R.I., Chowdhury J., Alam A., Hearn M.T. Analysis of peptides and protein digests by reversed phase high performance liquid chromatography-electrospray ionisation mass spectrometry using neutral pH elution conditions // Anal. Chim. Acta. 2015. Vol. 4. N. 872. P. 84–94. DOI: 10.1016/j.aca.2015.02.055.
-
Beyene A.M., Du X., Schrunk D.E. et al. High-performance liquid chromatography and Enzyme-Linked Immunosorbent Assay techniques for detection and quantification of aflatoxin B1 in feed samples: a comparative study // BMC Res. Notes. 2019. Vol. 12. P. 492. DOI: 10.1186/s13104‑019‑4538‑z.
-
Cross T.G., Hornshaw M.P. Can LC and LC-MS Ever Replace Immunoassays? // J. Appl. Bioanal. 2016. Vol. 2. N. 4. P. 108–116. DOI: 10.17145/jab.16.015.
-
Curwin B., Hein M., Barr D. et al. Comparison of immunoassay and HPLC-MS/MS used to measure urinary metabolites of atrazine, metolachlor, and chlorpyrifos from farmers and non-farmers in Iowa // J. Expo.Sci. Environ. Epidemiol. 2010. Vol. 20. P. 205–212. DOI: 10.1038/jes.2009.15.
-
Pinho A.R., Fortuna A., Falcão A. et al. Comparison of ELISA and HPLC-MS methods for the determination of exenatide in biological and biotechnology-based formulation matrices // Journal of Pharmaceutical Analysis. 2019. Vol. 9. N. 3. P. 143–155. DOI: 10.1016/j.jpha.2019.02.001.
-
Rubio F., Veldhuis L.J., Clegg B.S., Fleeker J.R., Hall C.J. Comparison of a Direct ELISA and an HPLC Method for Glyphosate Determinations in Water // Journal of Agricultural and Food Chemistry. 2003. Vol. 51. N. 3. P. 691–696. DOI: 10.1021/jf020761g.
-
Wilson R. Sensitivity and specificity: twin goals of proteomics assays. Can they be combined? // Expert Review of Proteomics. 2013. Vol. 10. N. 2. P. 135–149. DOI: 10.1586/epr.13.7.
-
Guidance for Industry. Exposure-Response Relationships — Study Design, Data Analysis, and Regulatory. U.S. Department of Health and Human Services, Food and Drug Administration. Center for Drug Evaluation and Research (CDER). Center for Biologics Evaluation and Research (CBER). 2003. 28 p. URL: https://www.fda.gov/media/71277/download (06.2022).
-
Guideline on non-clinical and clinical development of similar biological medicinal products containing low-molecular-weight-heparins. EMEA/CHMP/BMWP/118264/2007 Rev. 1. 2017. 8 р. URL: https://www.ema.europa.eu/en/documents/scientific-guideline/guideline-non-clinical-clinical-development-similar-biological-medicinal-products-containing-low_en.pdf (06.2022).
-
Kosman V.M., Karlina M.V., Faustova N.M., Makarov V.G., Makarova M.N. Comparison of biomarker and chromatographic analytical approaches to pharmacokinetic study of sitagliptin // Biopharmaceutics and Drug Disposition. 2022. Vol. 43. N. 1. P. 3–10. DOI: 10.1002/bdd.2305.
-
Kosman V.M., Faustova N.M., Karlina M.V., Makarov V.G., Makarova M.N. Use of Biomarkers in Pharmacokinetics Studies of Medicinal Products of Natural Origin // The Bulletin of the Scientific Centre for Expert Evaluation of Medicinal Products. 2021. Vol. 11. N. 1. P. 24–35. DOI: 10.30895/1991‑2919‑2021‑11‑1‑24‑35.
-
Karlina M.V., Faustova N.M., Pozharitskaya O.N. et al. Determination of darbopoetin alfa in rabbit plasma by ELISA // Drug development and registration. 2016. Vol. 4. P. 204–210. (In Russ.).
-
Kosman V.M., Faustova N.M., Karlina M.V., Makarov V.G., Makarova M.N. Study of pharmacokinetic of new peptide drug 1‑deamino-arginine-vasotocin for hypernatremia correction // Research Results in Pharmacology. 2022. Vol. 8. N. 1. P. 23–31. DOI: 10.3897/rrpharmacology.8.71802.
-
Van Dorpe S., Adriaens A., Polis I. et al. Analytical characterization and comparison of the blood-brain barrier permeability of eight opioid peptides // Peptides. 2010. Vol. 31. N. 7. P. 1390–1399. DOI: 10.1016/j.peptides.2010.03.029.
-
Eagleton R.D., Mitchell S.A., Huber J.D. et al. Improved blood-brain barrier penetration and enhanced analgesia of an opioid peptide by glycosylation // J. Pharmacol. Exp. Ther. 2011. Vol. 299. N. 3. P. 967–972.
-
Ogawa T., Araki M., Miyamae T. et al. Synthesis and antinociceptive activity of orally active opioid peptides: improvement of oral bioavailability by esterification // Chem. Pharm. Bul. l (Tokyo). 2003. Vol. 51. N. 7. P. 759–771. DOI: 10.1248/cpb.51.759.
-
Furuhata M., Kawakami H., Tom K., Hattori Y., Maitani Y. Intracellular delivery of proteins in complexes with oligoarginine-modified liposomes and the effect of oligoarginine length // Bioconjugate chemistry. 2006. Vol. 17. N. 4. P. 935–942. DOI: 10.1021/bc060034h.
-
Futaki S. Oligoarginine vectors for intracellular delivery: design and cellular-uptake mechanisms // Biopolymers. 2006. Vol. 84. N. 3. P. 241–249. DOI: 10.1002/bip.20421.
-
Pham W., Zhao B.Q., Lo E.N. et al. Crossing the bloodbrain barrier: a potential application of myristoylated polyarginine for in vivo neuroimaging // NeuroImage. 2005. Vol. 28. N. 1. P. 287–292. DOI: 10.1016/j.neuroimage.2005.06.007.
-
Szeto H.H., Lovelace J.L., Fridland G. et al. In vivo pharmacokinetics of selective mu-opioid peptide agonists // J. Pharmacol. Exp. Ther. 2001. Vol. 298. N. 1. P. 57–61.
-
Robinson M.A., Guan F., McDonnell S., Uboh C.E., Soma L.R. Pharmacokinetics and pharmacodynamics of dermorphin in the horse // J. Vet. Pharmacol. Ther. 2015. Vol. 38. N. 4. P. 321–329. DOI: 10.1111/jvp.12179.
- Chiu L.S., Anderton R.S., Clark V.W. et al. Tissue distribution of intravenously administeredpoly-argininepeptide R18D in healthy male Sprague — Dawley rats // Future Drug Discovery. 2020. Vol. 2. P. 2. DOI: 10.4155/fdd-2019-0039.